Debug SPFx React webpart with Visual Studio Code
I decided to create this guide due to lack of many articles at the current time
Official guidance already available. Please follow the steps mentioned in Debug SharePoint Framework solutions in Visual Studio Code
I found only one useful article on this link by Elio Struyf on how to debug SPFx. However, I decided to provide you with modified setup where you just hit F5 like a boss :)
Prerequisites
I assume that you already have
- Chrome browser installed
- Visual Studio Code installed
- SharePoint Framework installed
- Hello World SharePoint web app created
- Hello World SharePoint web app loaded in Visual Studio Code
- And the local test SPFx nodejs server is running ("gulp serve" command executed)
Install the "Debugger for Chrome" extension for VS Code
- Open Visual Studio Code - Go to top menu -> View -> Extensions (or Crtl+Shift+X)

- Type "Chrome" in the top right Extensions input box
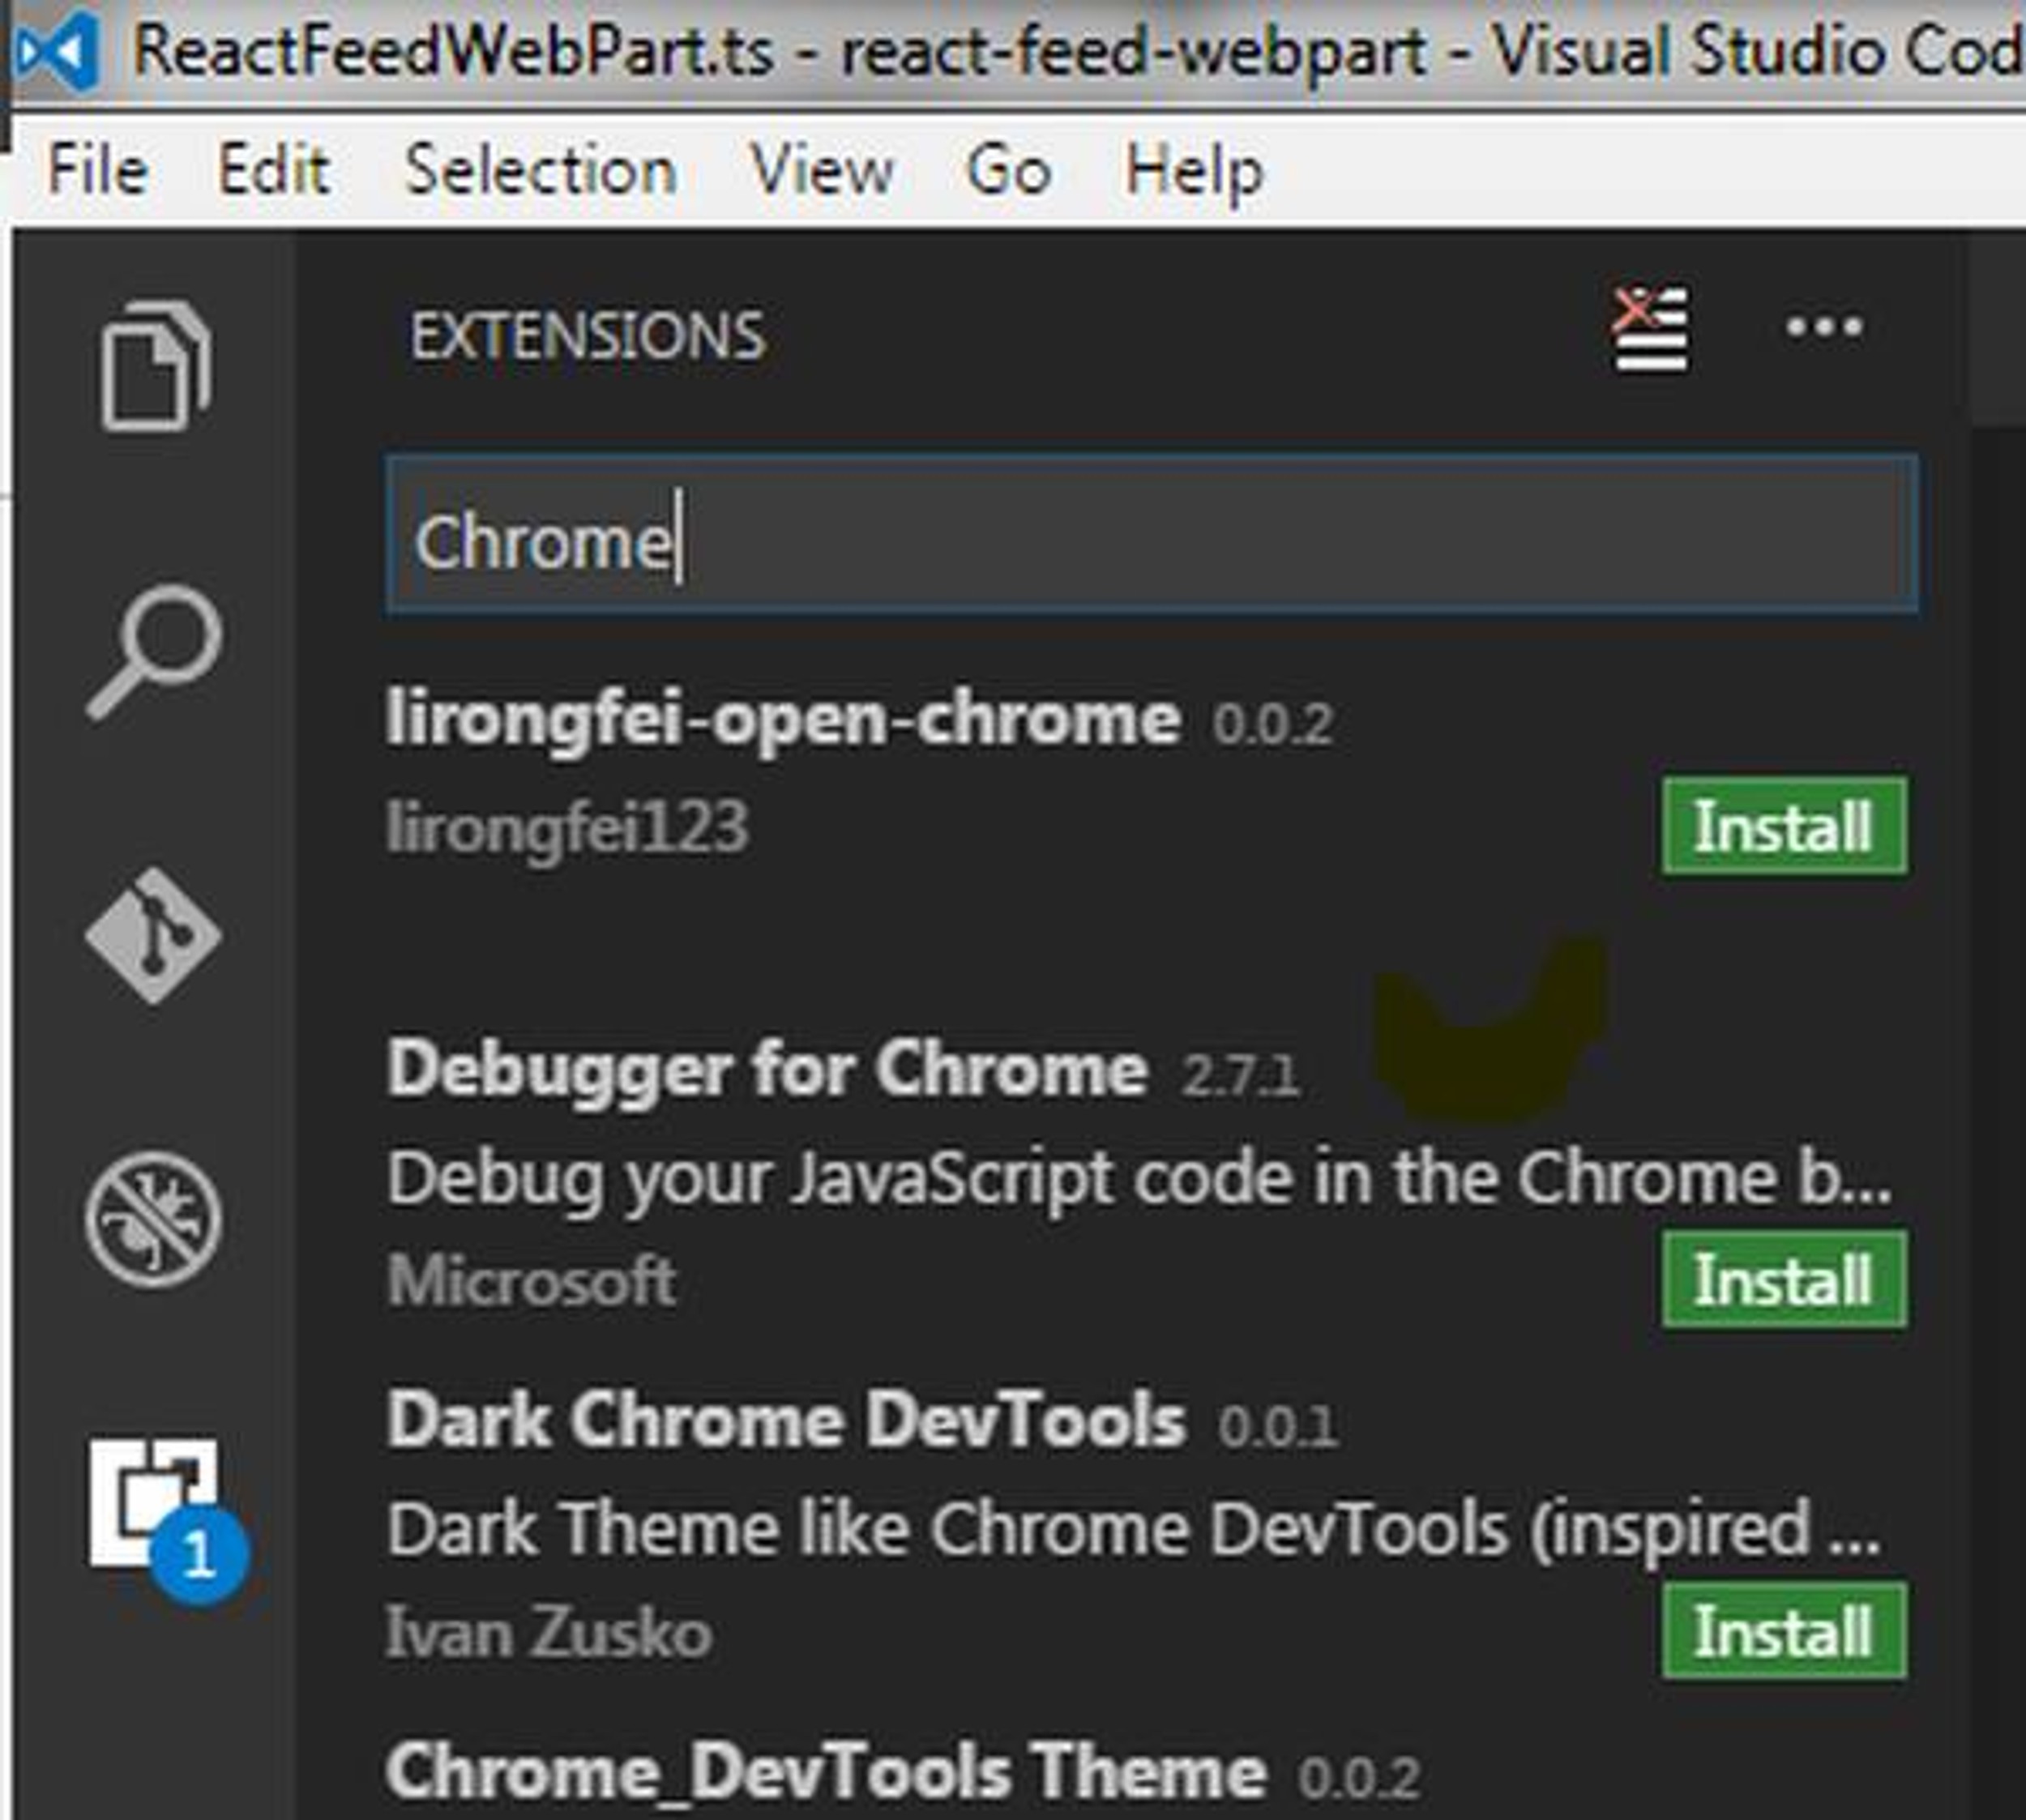
- You should be able to see the "Debugger for Chrome" extension - Install it and reload the VS Code
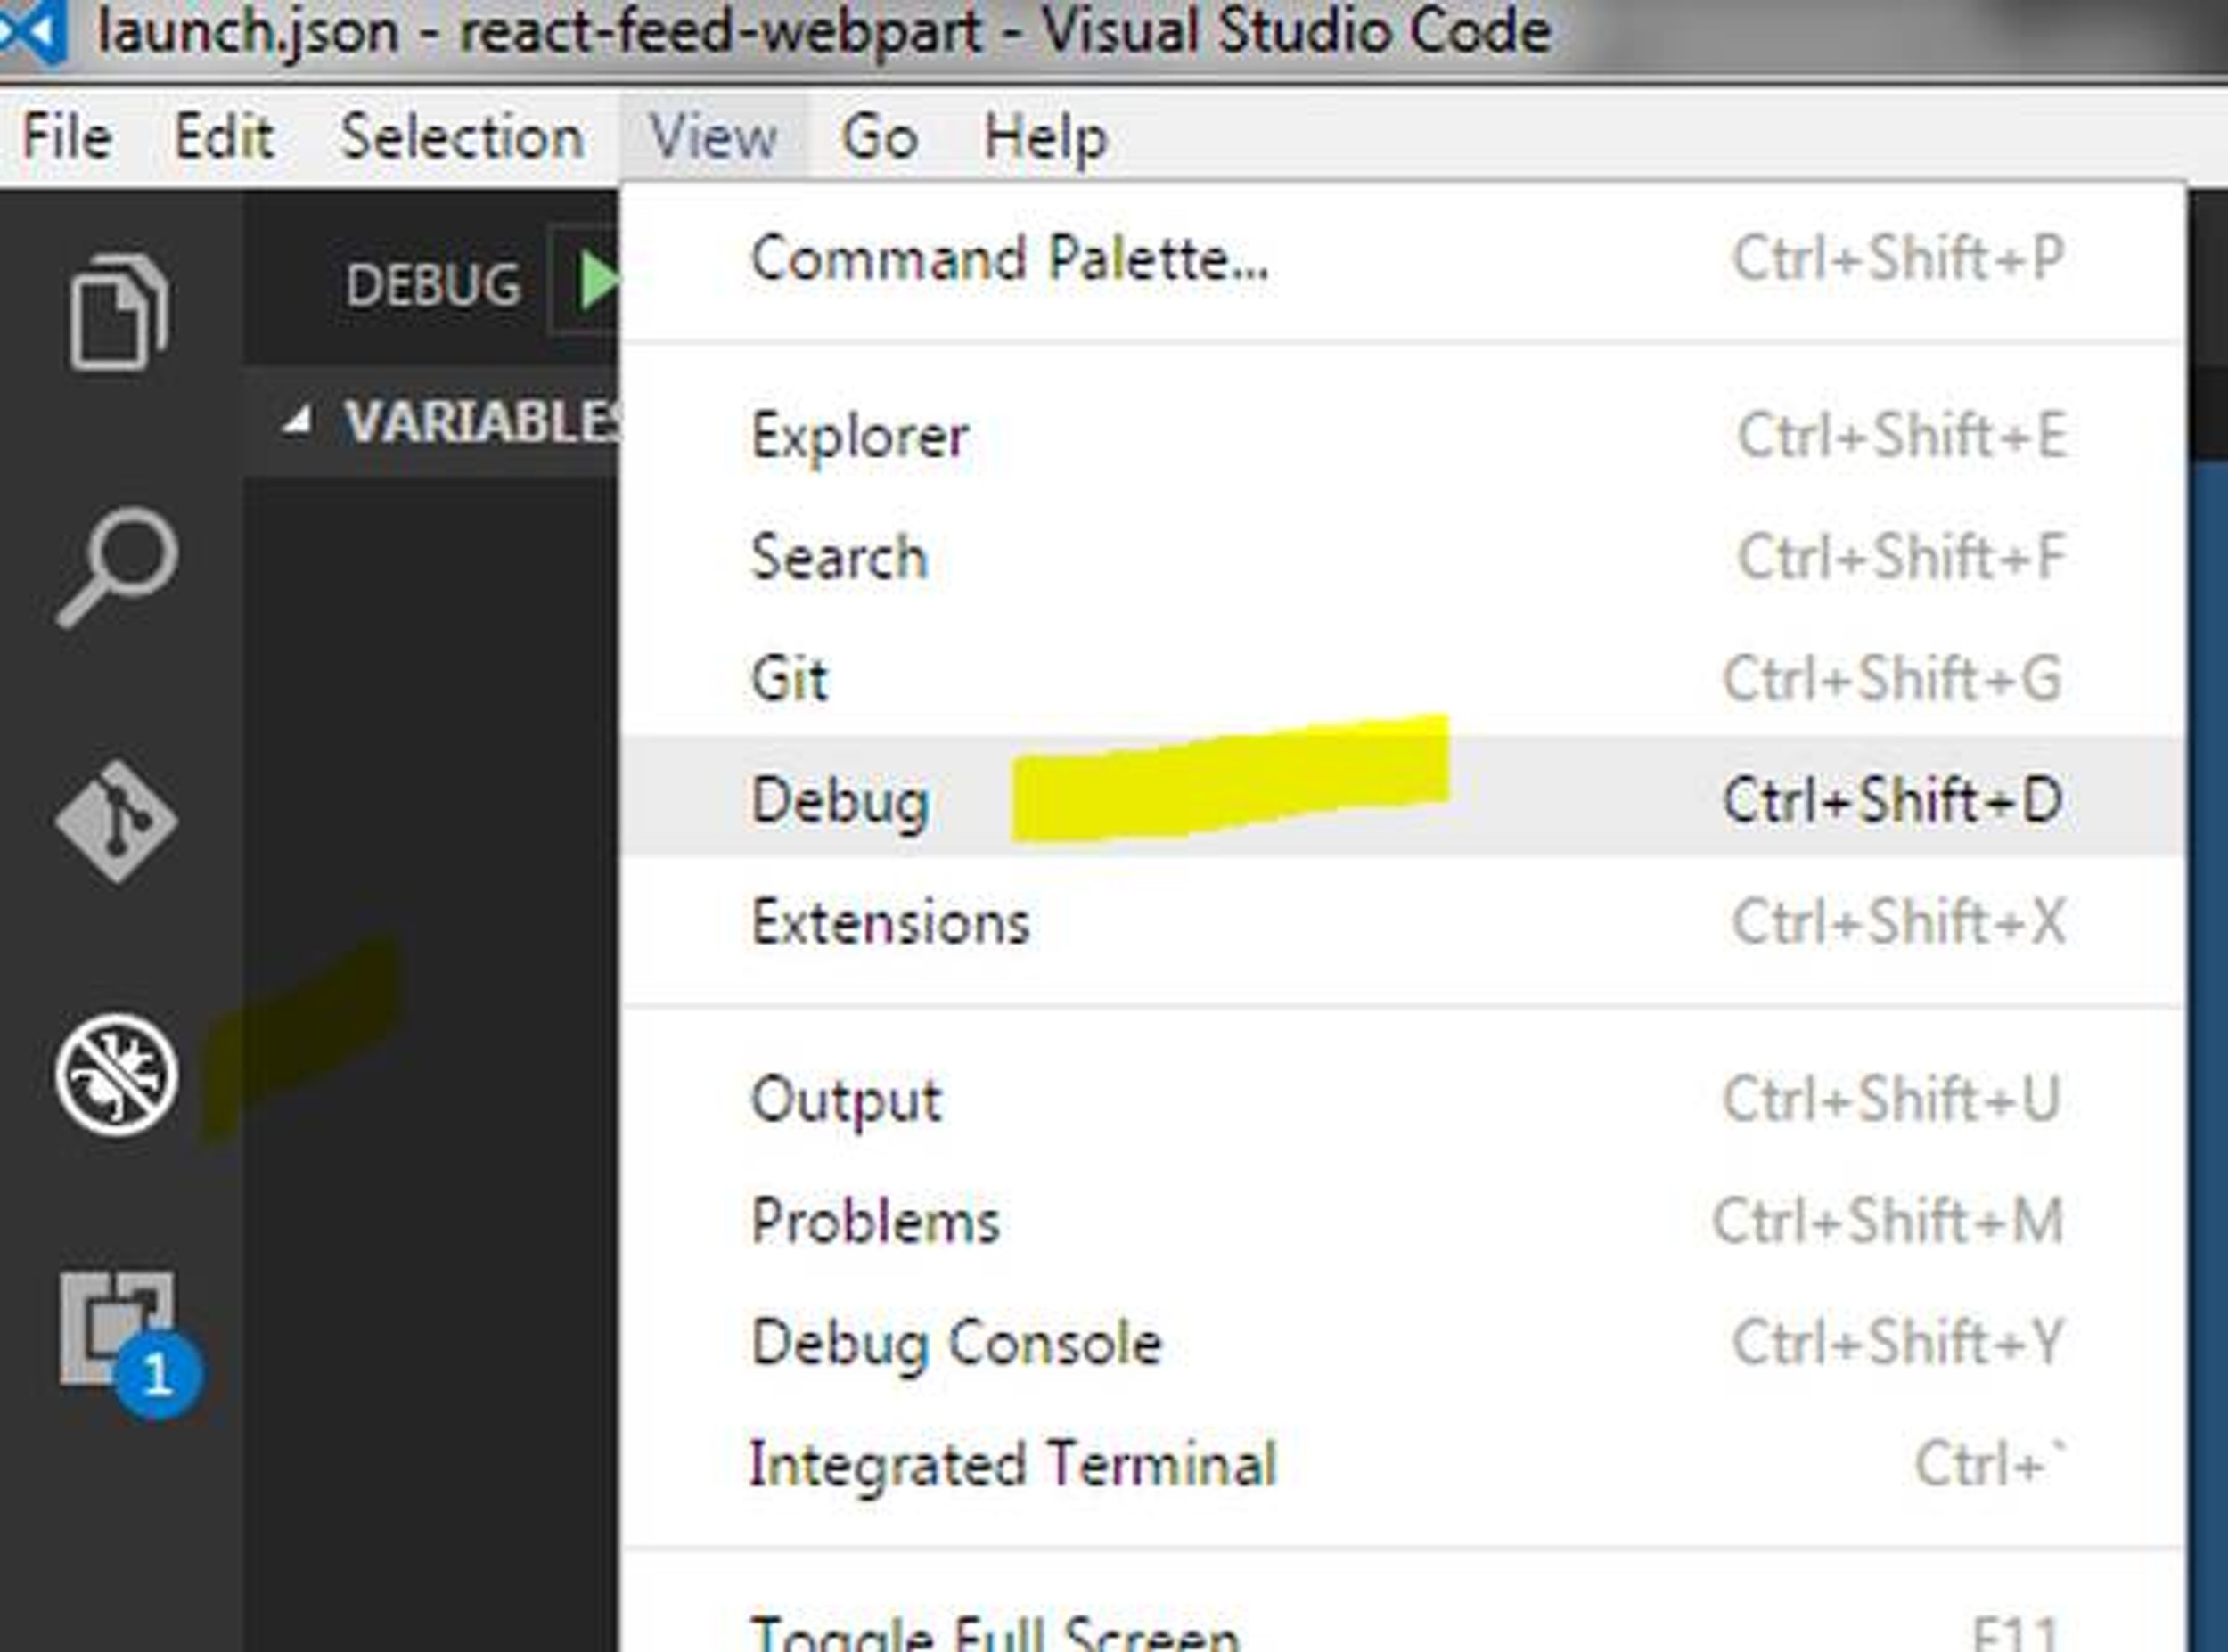
Add Visual Code Debug launch configuration
- Go to VS Code debug view. You can do it from top menu -> View -> Debug
- Add new debug launch configuration
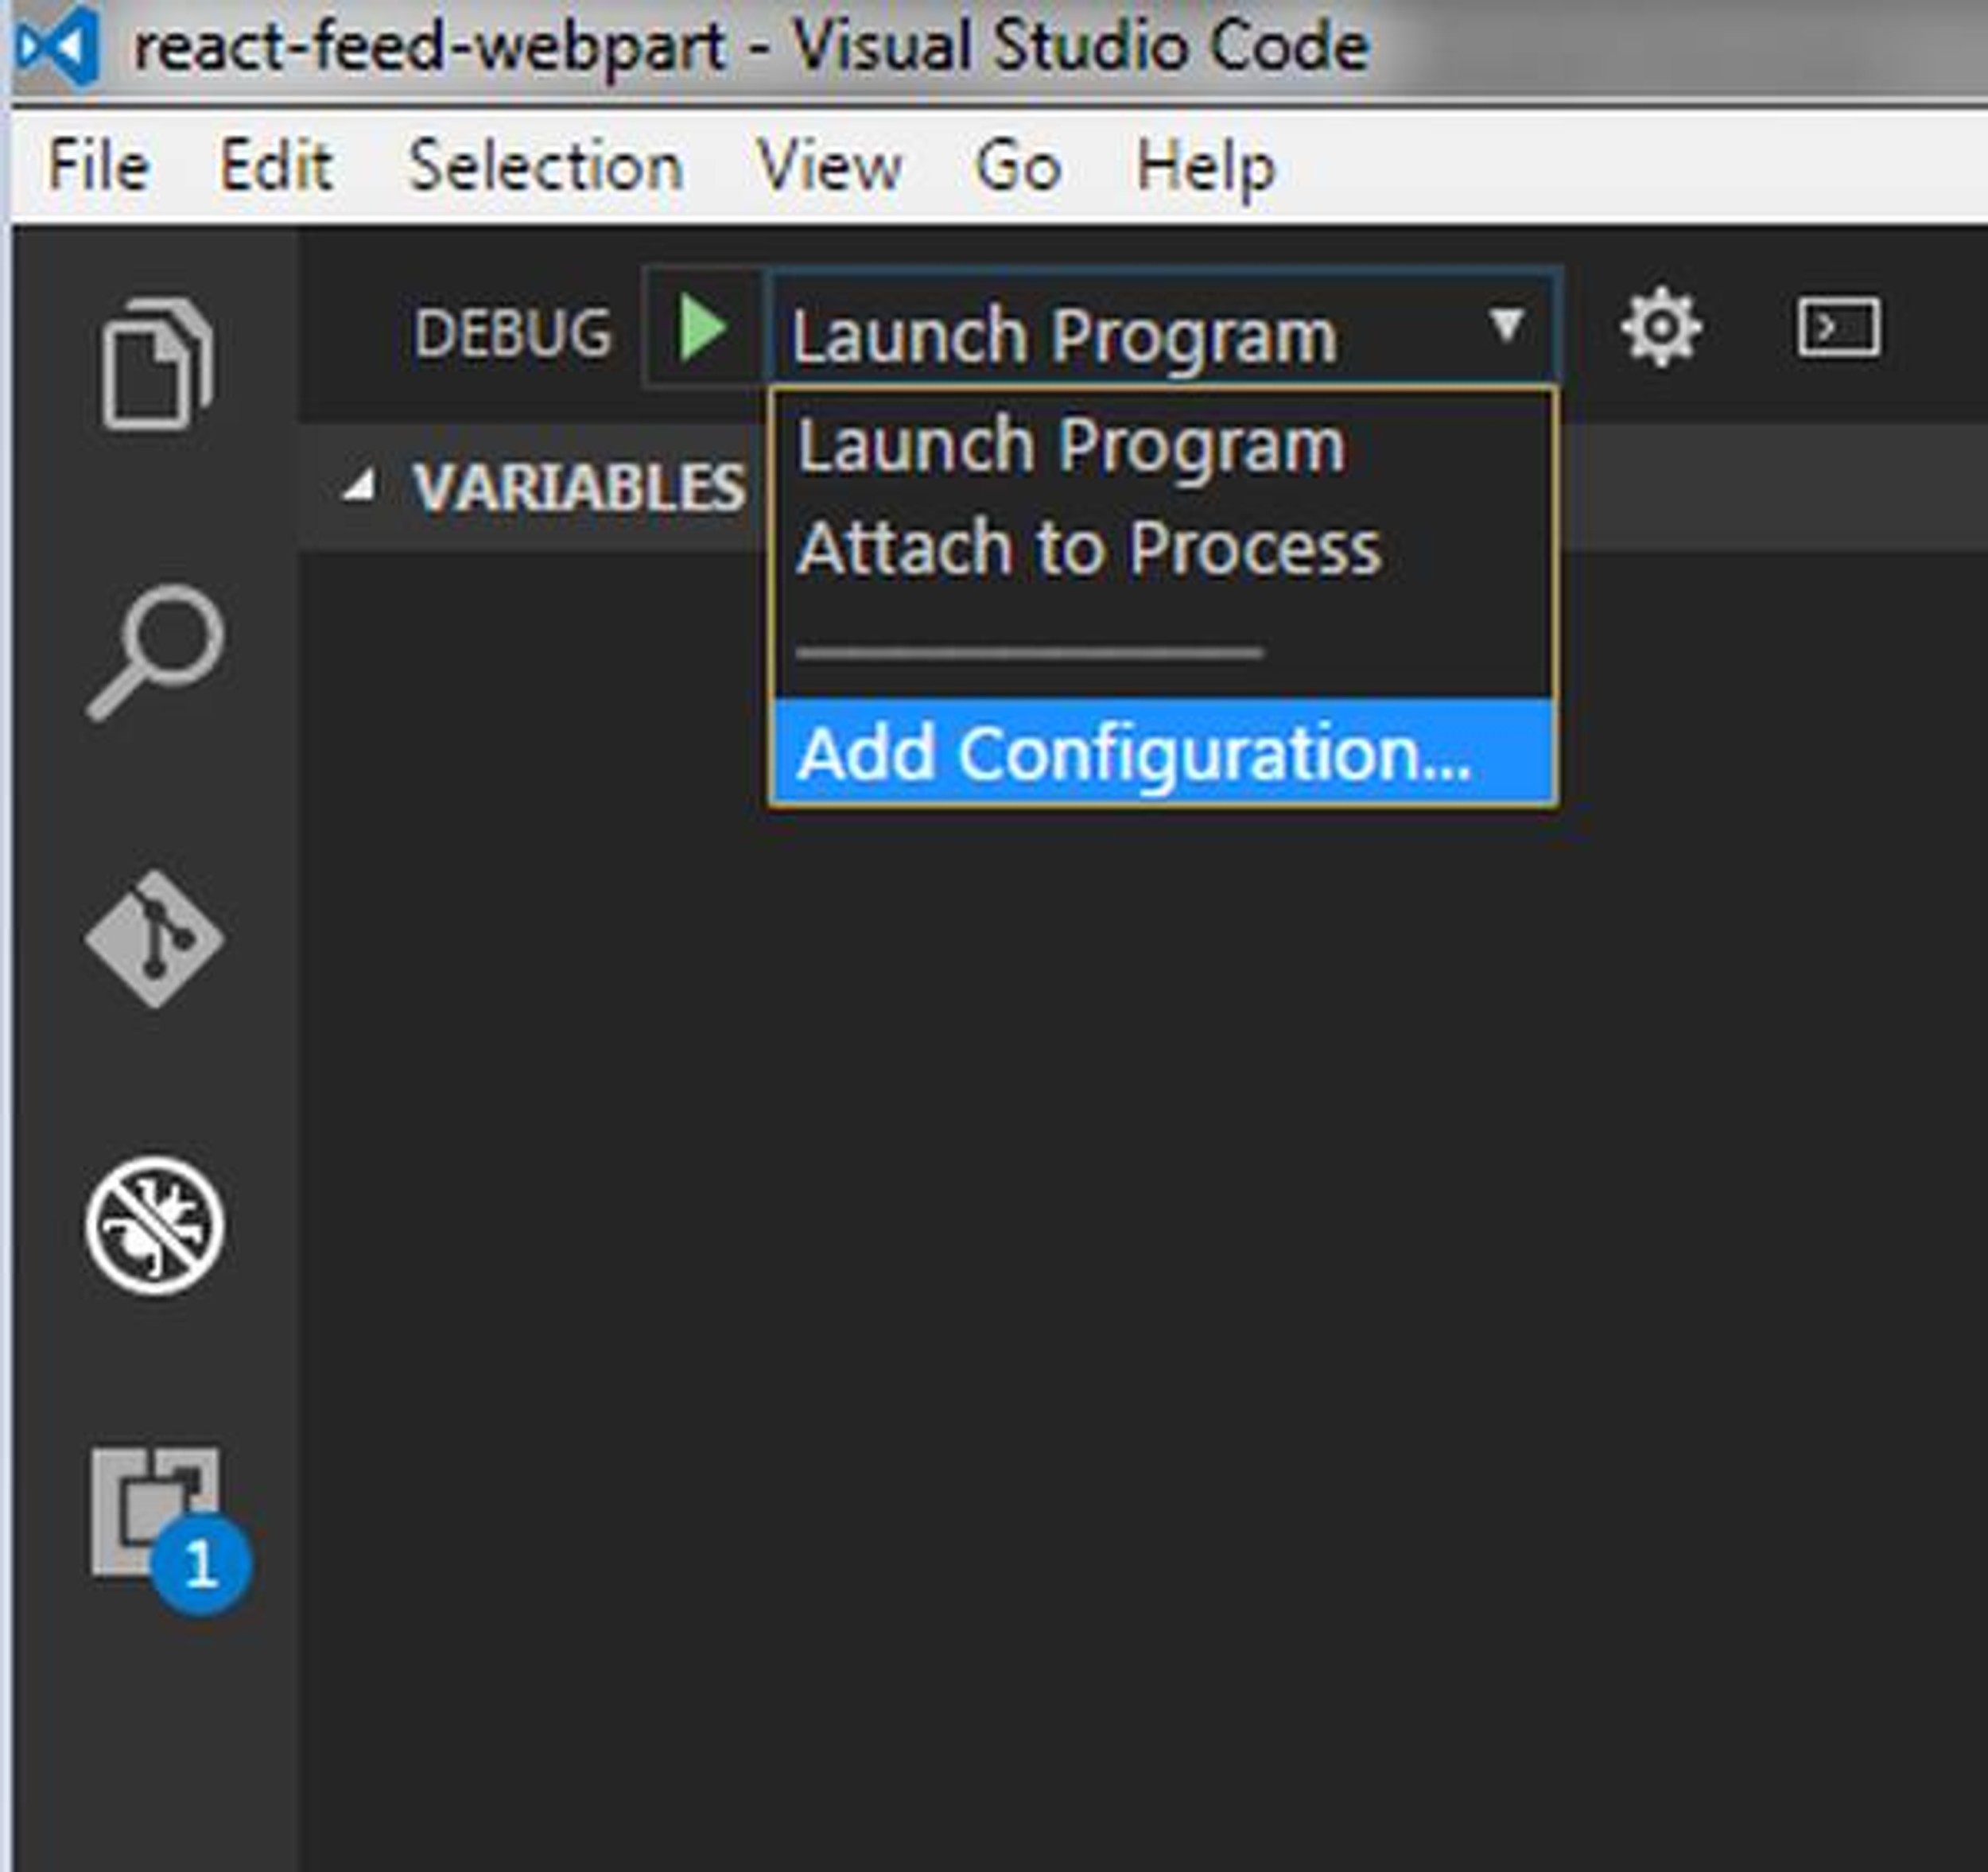
- Paste this configuration in the launch.json (borrowed from Elio Struyf and Michel Weber and modified a bit).
Lunch the Chrome browser in debug mode and hit a break point in VS Code
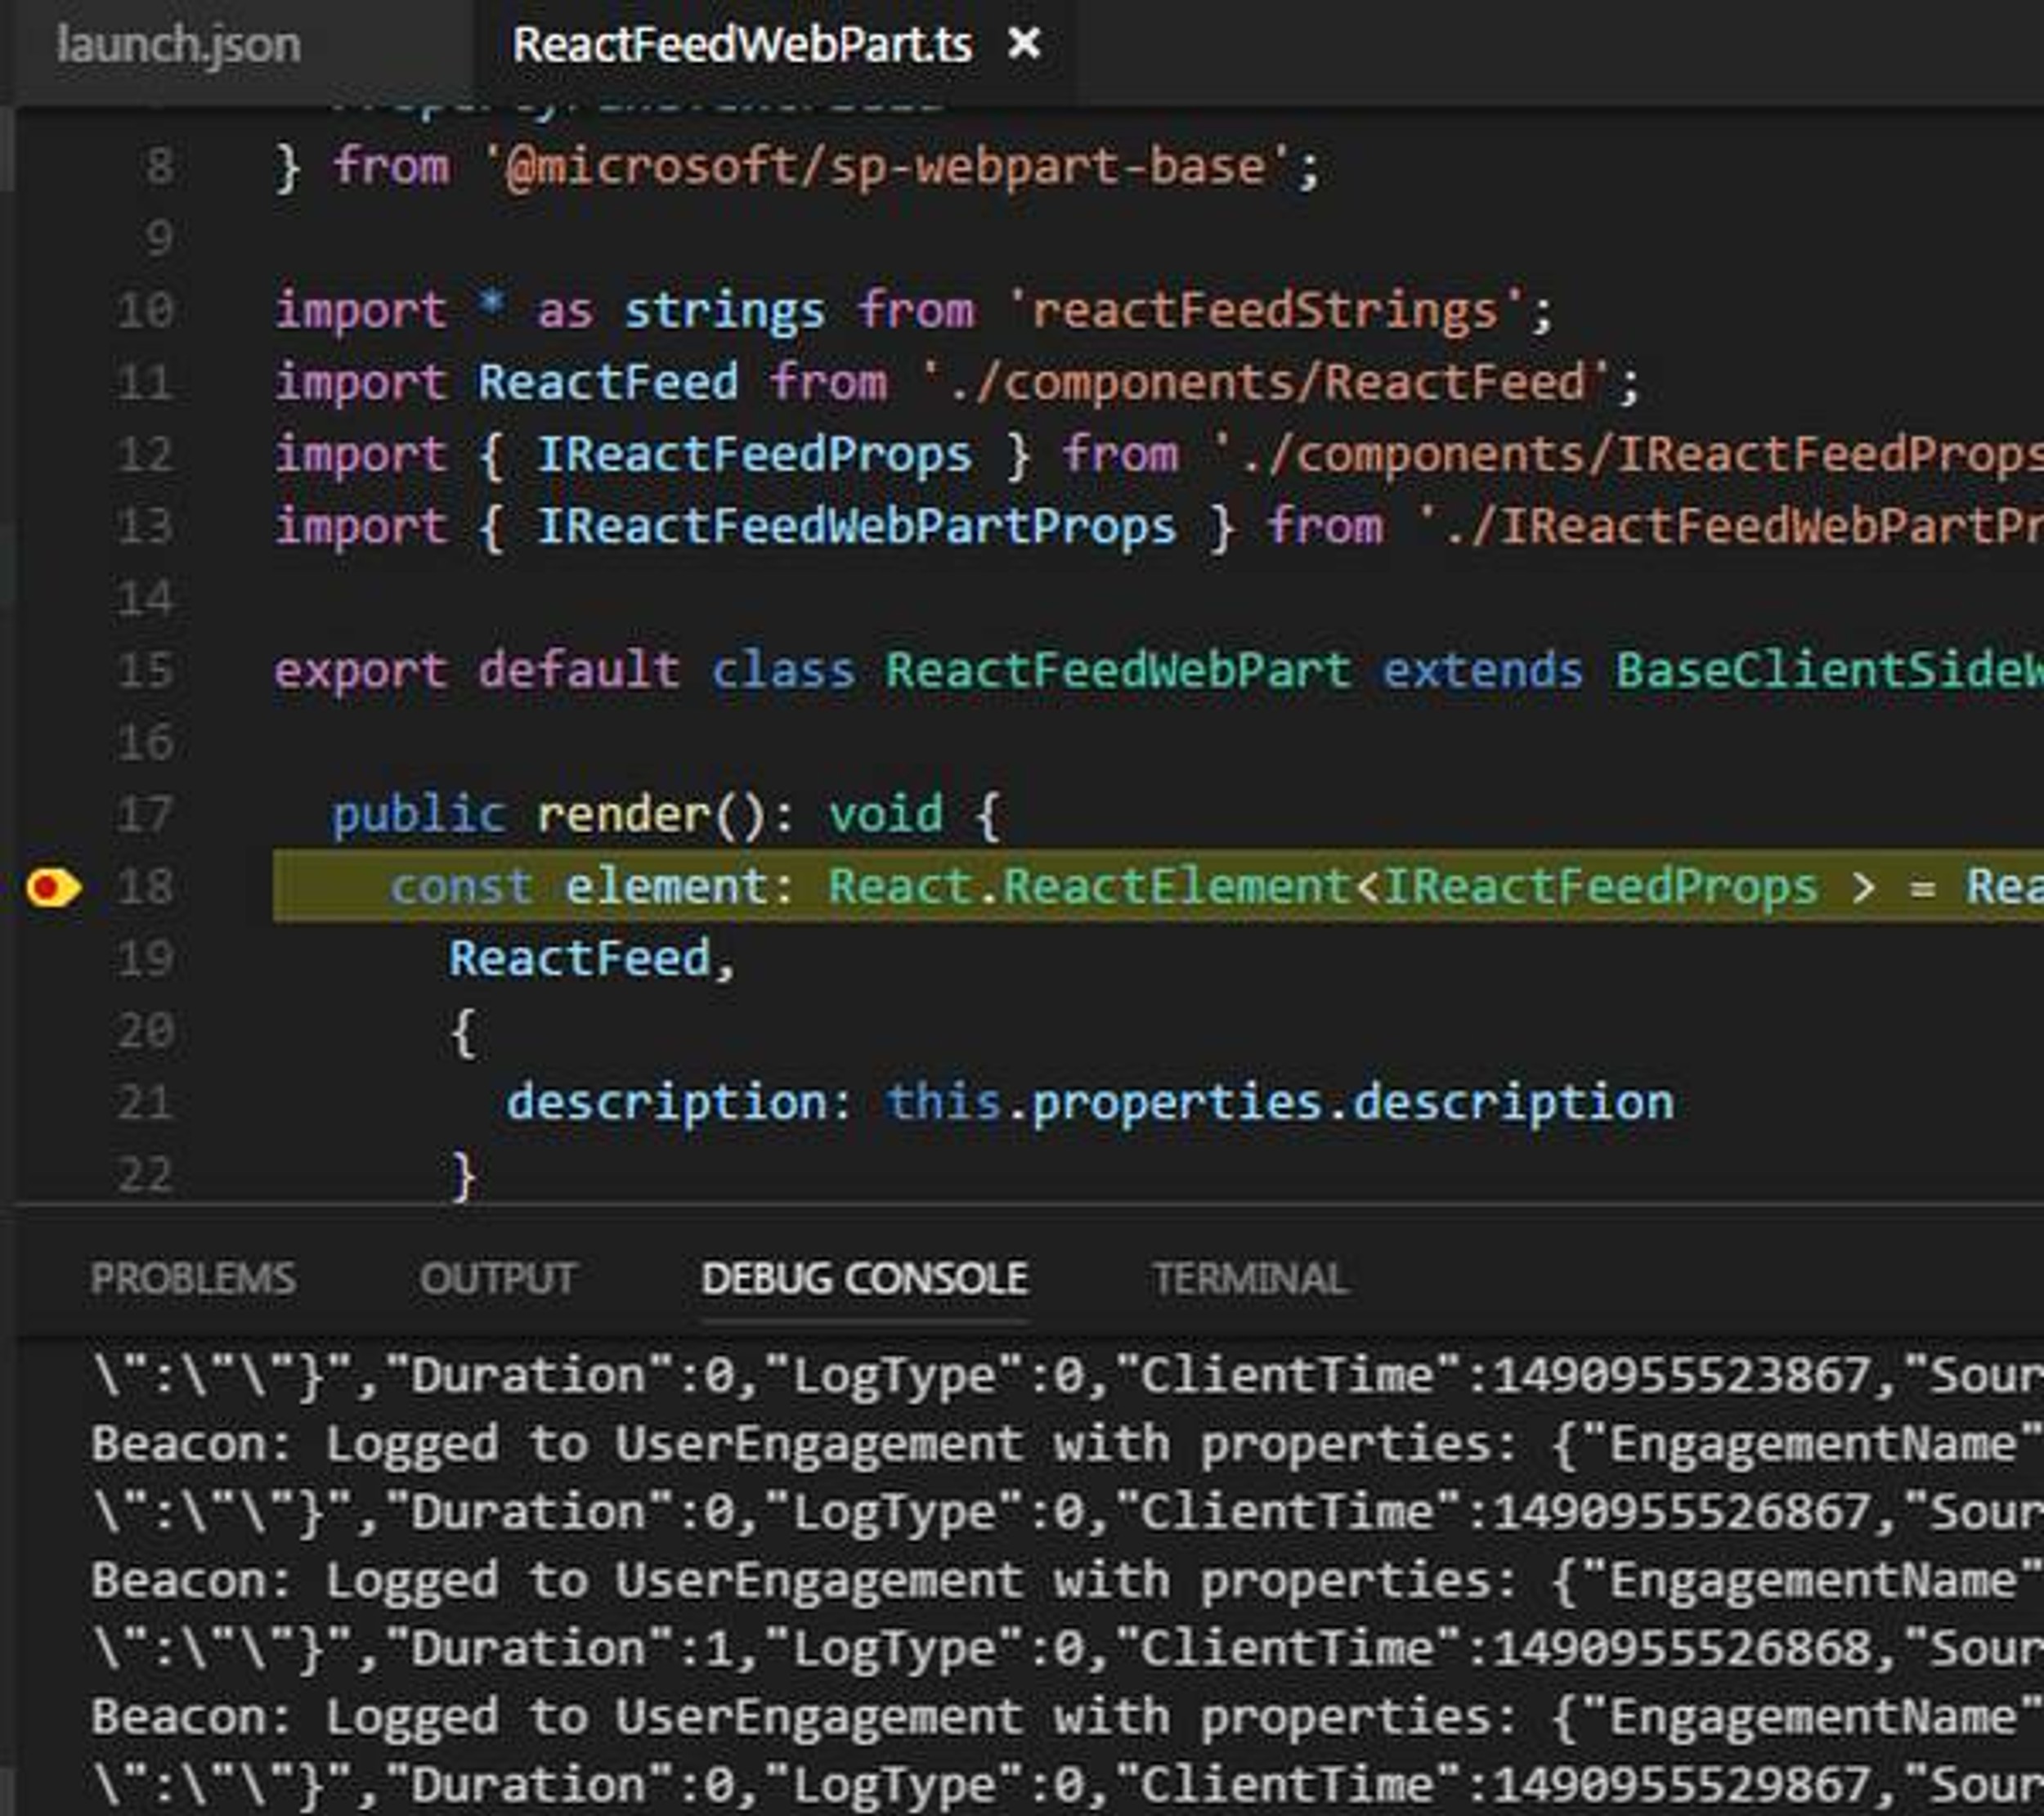
- Go to the VSCode Explorer (top menu -> View -> Explorer) - Navigate to ReactFeedWebPart.ts and add breakpoint to line 18 for example.

- Close all active Chrome browser instances. This is important for the debugger to be properly attached
- Start the SPFx nodejs server (if you haven't) by executing "gulp serve" from the webpart folder
- Go to VS Code debug view (top menu -> View -> Debug)
- Hit the play (start debugging) button
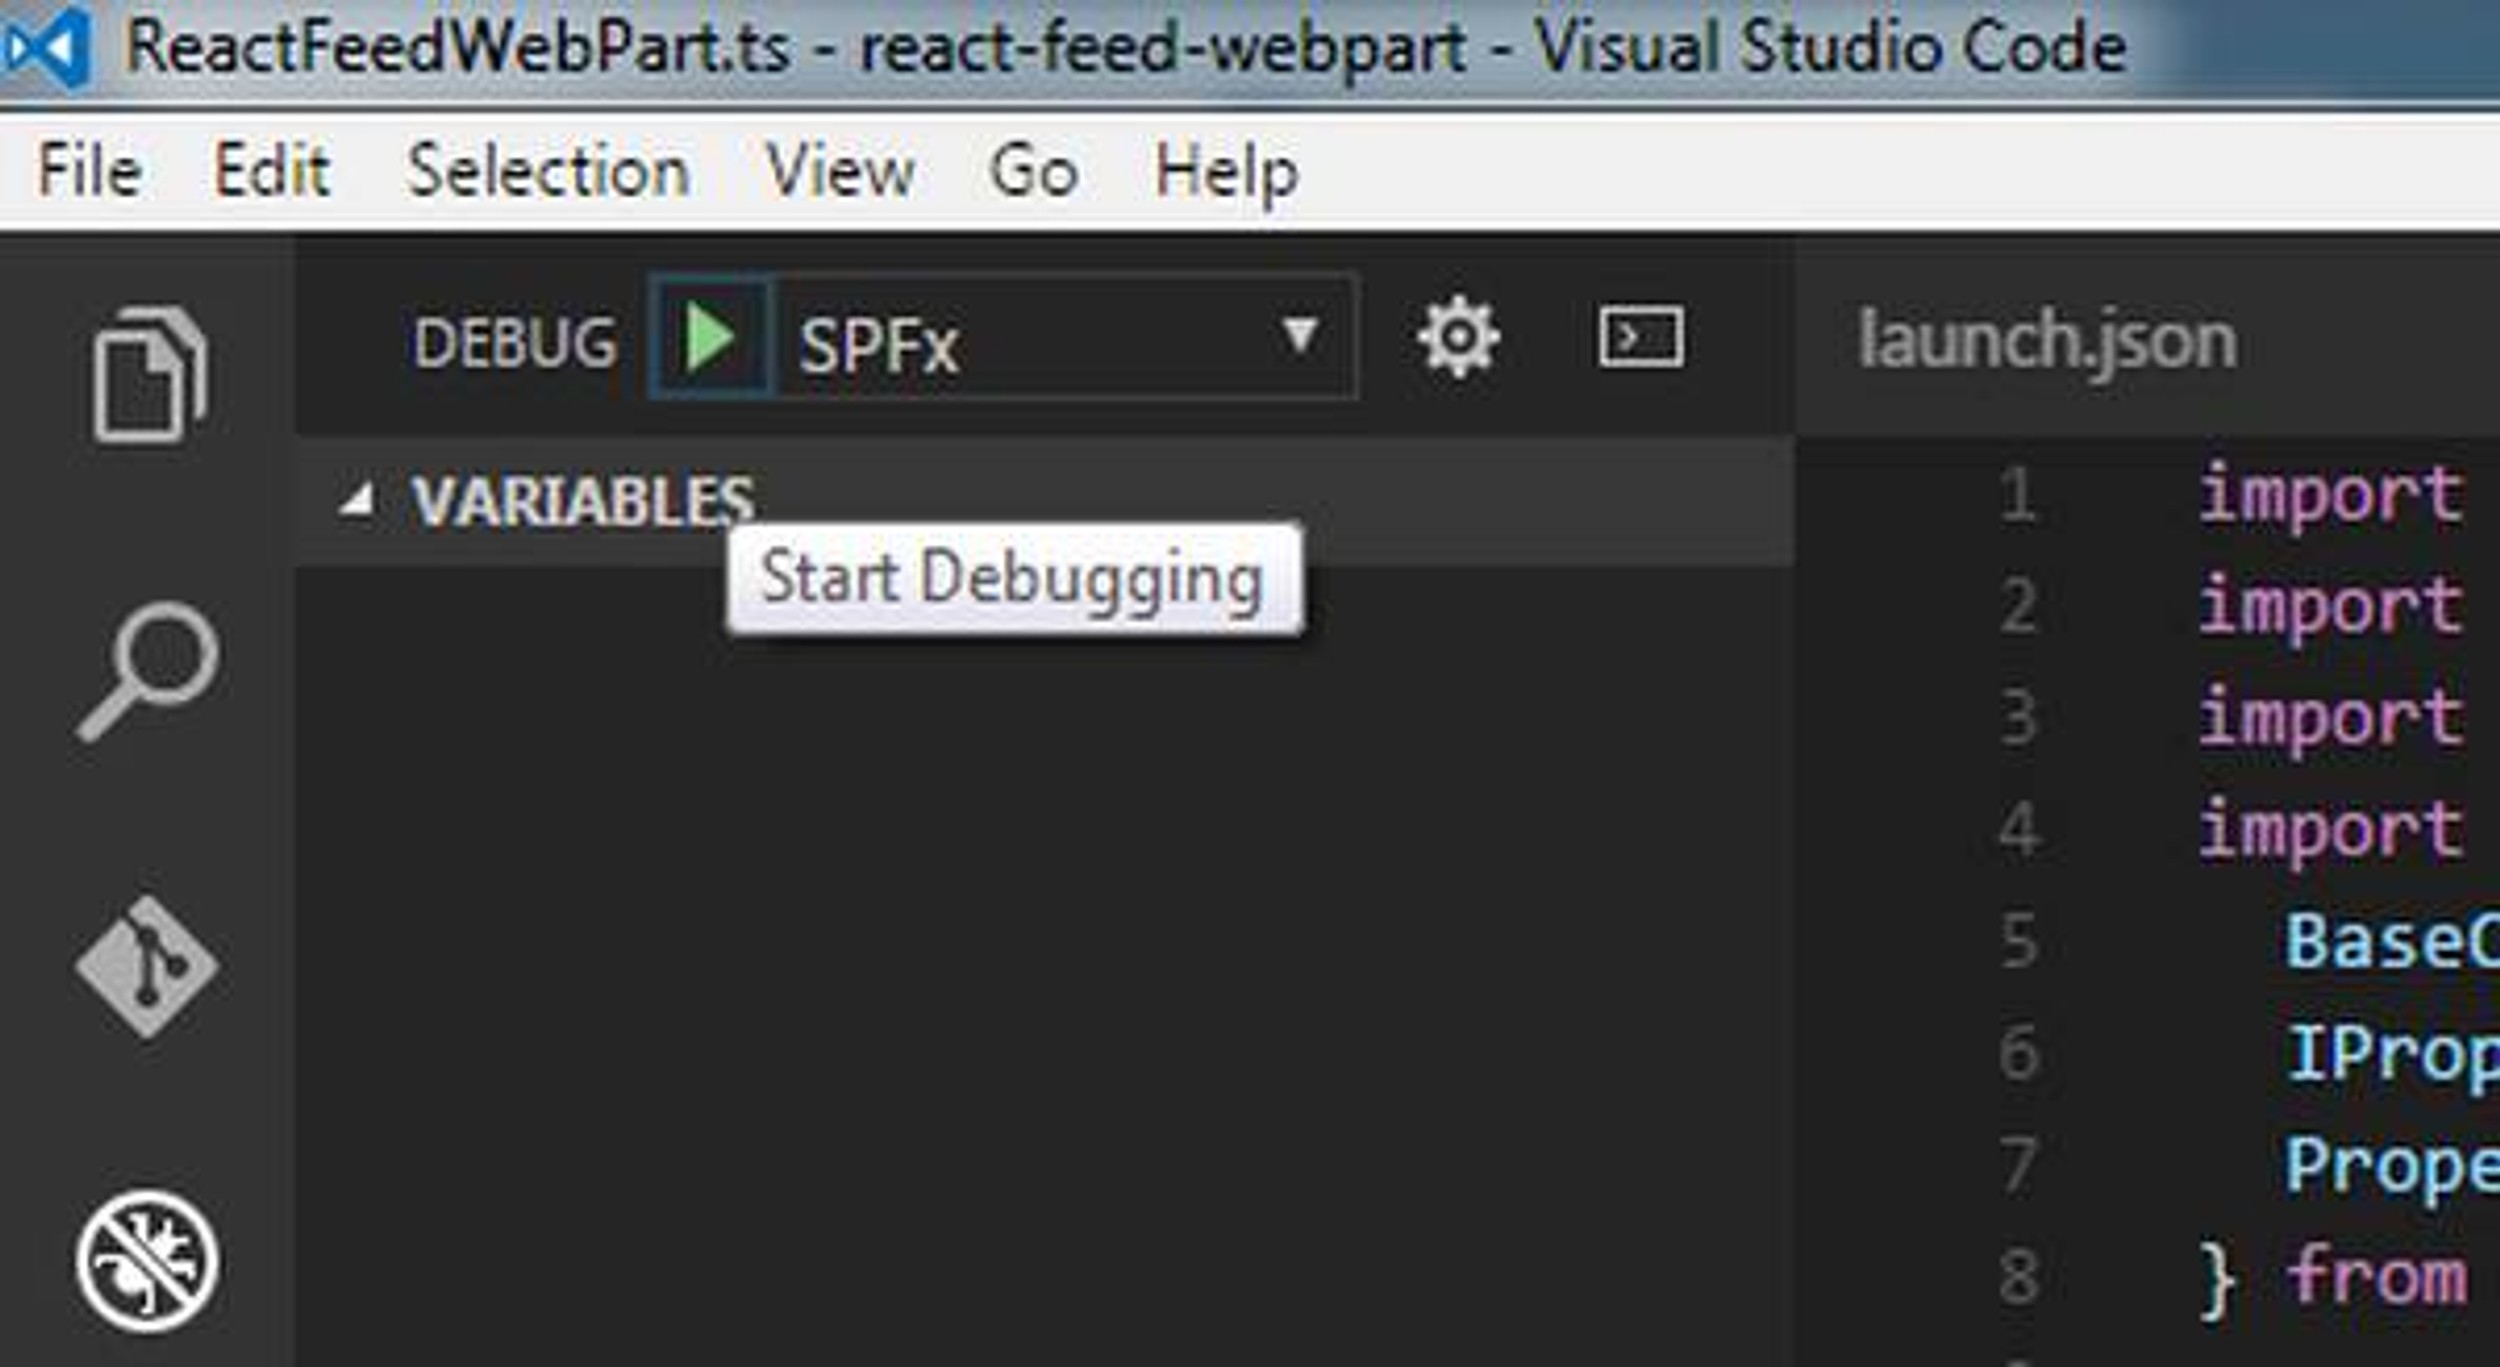
- This should open new Chrome browser with the local workbench - Add your Hello World webpart to the start page - Click the workbench preview button

- The breakpoint should be hit by now
Good... we managed to run it locally, but how about running on a SharePoint Online site and debugging from VS Code?
Here is how to VS Code debug SPFx React webpart deployed to a SharePoint site
- Deploy your webapp to Office 365 SharePoint site. Here is a link to guide on how to do it
- Add the webpart to the site you will be using for the debugging purposes (link)
- Go to the VS code debug configuration again (the launch.json file) and extend it by adding another one for the online version
- The difference is really just the online site page you will be debugging
- Add your webpart to the SharePoint Online site page that you have set up in the configuration
- Repeat the "Lunch the Chrome browser in debug mode and hit a break point in VS Code" step, but with your new "SPFx Online" launch confuguration to verify that works

Do not forget that the local nodejs server should be up and running (gulp serve --nobrowser) and all Chrome instances should be closed before you hit the debug button from VS Code The site page url can be replaced with the online workbench as well
or just a separate configuration for the online workbench can be added to the launch file. The full launch.json Gist Available on Github Updated: Recently the office team created more detailed guide. You can find it on this link.
Happy debugging! Sharing is Caring